
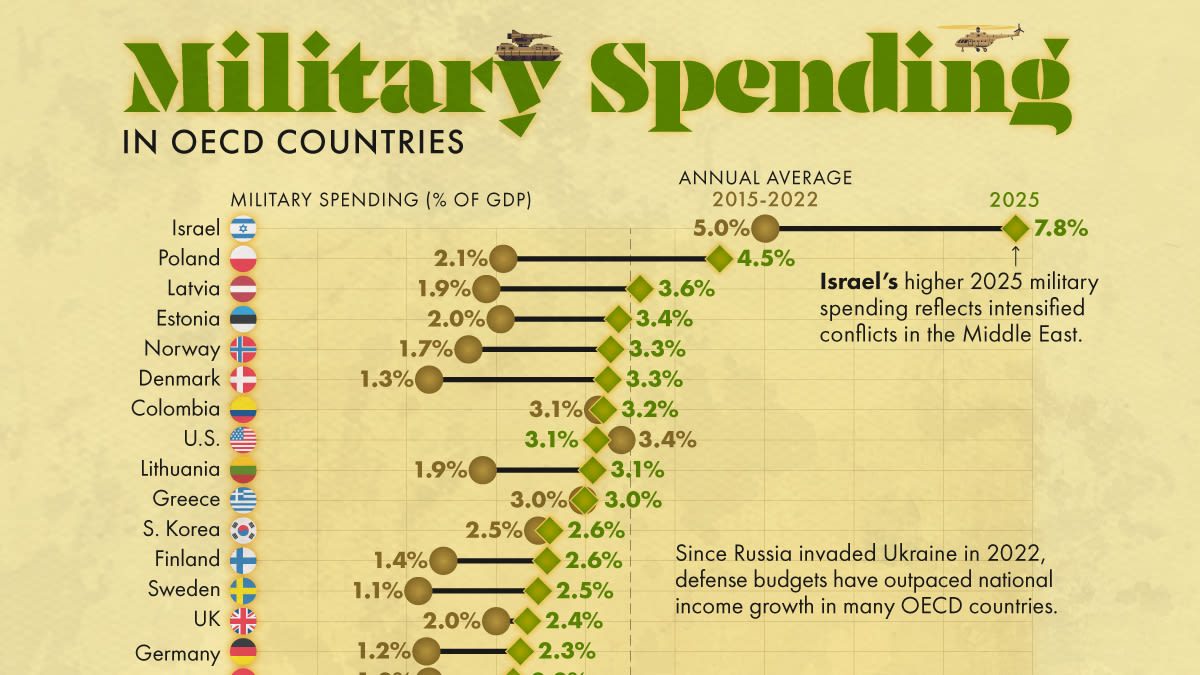
Something structural is happening inside OECD government budgets, and the bond market is treating it like a rounding error. Across the 38-member bloc, military expenditure in 2025 is tracking toward a combined figure north of $1.5 trillion, the highest in real terms since the Cold War demobilization era of the early 1990s. NATO members alone have committed to the 2 percent of GDP defense spending floor, a threshold that 23 of 32 allies now meet or exceed, up from just 11 in 2023. That is not a marginal budget line adjustment. That is a generational reallocation of sovereign capital, and it carries fiscal, inflationary, and sectoral consequences that most macro frameworks are still treating as noise. If you manage duration risk, run equity factor books, or hold any sovereign debt exposure in Europe or the Pacific, the arithmetic of this spending wave is your problem whether you choose to engage with it or not.
The Spending Trajectory That Changes Fiscal Math
Poland is currently allocating 4.1 percent of GDP to defense, the highest ratio in the entire NATO alliance, surpassing even the United States, which sits at roughly 3.4 percent. Estonia, Latvia, and Lithuania are all above 3 percent. Germany, historically the great holdout, has passed a constitutional amendment removing its defense budget from the debt brake mechanism and is targeting a jump from 1.57 percent to above 3 percent of GDP over the medium term. That single German decision unlocks what Deutsche Bank estimates could be 100 billion euros of additional annual military procurement over a multi-year horizon.
The macro consequence that gets underweighted is what this does to European sovereign debt supply. Germany's fiscal conservatism was the structural anchor of bund pricing for two decades. A Germany that issues materially more debt to fund defense transformation is a Germany whose risk-free rate behaves differently. European duration portfolios priced against bund benchmarks are carrying a basis risk that did not exist three years ago. The term premium embedded in 10-year bunds, which spent years negative, is being repriced, and defense spending is one of the underdiscussed structural contributors to that shift.
Beyond Europe, Japan has committed to doubling its defense budget to 2 percent of GDP by 2027, a policy reversal of historic magnitude for a country constitutionally restrained from projecting military force for the better part of 80 years. That commitment translates to approximately 10 trillion yen in incremental annual spending by the back half of this decade, funded through a combination of tax increases and JGB issuance. Japan's fiscal situation was already complex. The defense overlay makes the BoJ's yield curve control exit path considerably more fraught than it appears in headline summaries.
When 23 out of 32 NATO members are simultaneously moving to 2 percent of GDP or above, you are not watching a spending trend. You are watching a fiscal constitution being rewritten in real time, and the bond market has about two years before it fully internalizes what that means for sovereign supply.
Second and Third Order Effects Through Industrial Supply Chains
The first-order trade is obvious: defense primes benefit. Lockheed Martin, RTX, Northrop Grumman, BAE Systems, Rheinmetall, Leonardo and their peers are the direct recipients of contract flow. Rheinmetall is the most instructive case. Its order backlog has grown from roughly 25 billion euros in 2022 to above 60 billion euros in 2025, a figure that represents nearly five years of revenue visibility. The market has partially priced this, but the deeper read is what sustained multi-year backlogs do to pricing power and margin structure in a sector that historically operated on cost-plus government contracts with thin spreads.
The second-order effect runs through industrial inputs. Artillery shell production requires specific steel alloys, propellant chemicals, and rare earth components. European ammunition manufacturers are currently running at capacity constraints that will take three to five years to relieve through greenfield capital expenditure. This creates a sustained bid for specialty materials producers, certain chemical companies, and the capital equipment manufacturers who supply the production lines. The civilian industrial base is being quietly co-opted into the defense production ecosystem, and the equities that reflect this are not all labeled 'defense' in standard GICS classifications.
The third-order effect, and the one most consistently missed, is the labor market consequence. Defense manufacturing is skilled-labor intensive. A sustained ramp-up in production competes directly with aerospace, automotive, and advanced manufacturing for the same welders, systems engineers, and quality assurance technicians. In a tight European labor market, particularly in Germany and Poland where the ramp is most aggressive, this creates wage pressure that feeds back into non-defense sector costs and regional CPI components. Central banks modeling inflation purely through energy and food baskets are missing a slow-building structural input from defense-driven labor competition.
The Asset Class Repricing That Is Already Underway
European defense equities as a sector have outperformed the broader STOXX 600 by approximately 85 percent on a cumulative basis since February 2022. That is a dramatic move, but the historical analogy to US defense sector performance during the early 2000s post-9/11 buildup suggests the repricing cycle typically extends for seven to ten years when the underlying spending commitment is structural rather than cyclical. The US defense sector compounded at roughly 15 percent annually from 2001 to 2008 as the base budget more than doubled. The European equivalent is arguably earlier in that same trajectory.
Currency implications are underappreciated. Nations funding defense buildups through domestic debt issuance while running current account deficits, Poland and several Baltic states fit this description, face a structural pressure on their currencies as the debt stock rises relative to GDP. PLN and the Baltic states' euro peg dynamics deserve closer attention from EM-adjacent macro books. Conversely, nations like Norway with a sovereign wealth fund acting as a fiscal buffer and defense spending denominated in a commodity-linked currency operate from a structurally different position.
Credit markets are beginning to wake up. Investment-grade European industrial issuers with significant defense revenue exposure, Airbus's defense and space division, Thales, Safran, have seen spread compression that partly reflects the earnings visibility that government contracts provide. High-yield issuers in the defense supply chain, particularly Eastern European manufacturers scaling rapidly with debt, represent a different and less benign credit profile. The covenant structures in this part of the market deserve scrutiny as growth assumptions become more aggressive.
How Zentra Positions in a Regime Shift, Not a Trade
At Zentra Asset Management, our delta-neutral SPX options framework is built around regime identification. The distinction between a regime shift and a trade matters enormously when sizing and structuring positions. A trade has a catalyst, a duration, and an exit. A regime shift alters the underlying drift of volatility surfaces, sector correlations, and factor exposures in ways that require structural rather than tactical adaptation.
The OECD defense spending surge looks like a regime shift by every criterion we apply. It is policy-driven, meaning it is not mean-reverting to a prior equilibrium. It is multi-year in duration, with treaty commitments, parliamentary budget laws, and industrial contract timelines that extend well beyond typical business cycle horizons. And it is broad-based, spanning enough economies that it materially affects global fiscal aggregates, not just individual country balance sheets.
For our volatility strategies, this creates specific considerations. Defense sector volatility, historically low because of the stability of government contract revenue, may be entering a period of higher realized vol as production bottlenecks, cost overruns, and geopolitical escalation or de-escalation cycles create earnings uncertainty. Simultaneously, the correlation between defense equities and broader equity indices may structurally decline as the sector's earnings drivers diverge from the consumer and tech variables that dominate broad market indices. When correlations shift, dispersion strategies become more productive, and our book is positioned to exploit exactly that dynamic through selective options overlays on both the defense sector itself and its industrial supply chain adjacencies.
This is how we position at Zentra Asset Management
Delta-neutral strategies that profit from volatility, not direction. See our full track record and research library.
Access Zentra Asset Management →The 2025 OECD military spending rankings are being read primarily as a geopolitical scorecard, which country is pulling its weight, which is free-riding. That framing is analytically incomplete. The correct frame is fiscal, inflationary, and structural: where is sovereign capital being reallocated, what does that reallocation crowd out, what industries does it permanently accelerate, and what does it do to the term premium embedded in the debt instruments of the nations writing the checks. Over the next 24 to 36 months, the answers to those questions will matter more for European fixed income, industrial equity valuations, and volatility regime assumptions than almost any other macro input currently in consensus models. The investors who get ahead of that repricing are not making a bet on war or peace. They are making a bet on arithmetic, and arithmetic has a very good track record of eventually being right.